Do Elevator Callbacks Rise in Winter? The Canadian Data
By Sujit Katariya, ElevatorPlus · Published 13 Aug · Last updated 13 Aug · ~8 min read · Compliance reviewed by Mr. Sumeet Katariya
In short: Every vendor blog in this industry says elevator callbacks spike in winter. None of them cites a source, because in Canada no source exists. This is written for operators trying to plan seasonal capacity honestly. It covers what data actually exists, what TSSA's own records show when you cut them by month, and the one part of the winter story that is genuinely supported.
Key takeaways
- No Canadian regulator publishes seasonal elevator failure data. Not TSSA, not Technical Safety BC. If you have seen a "callbacks rise X% in winter" figure for Canada, it has no published source behind it.
- The definitive Canadian availability study never mentions weather once. TSSA's 2017 Elevator Availability Study runs to hundreds of pages and contains zero occurrences of season, winter, weather, cold, temperature or snow.
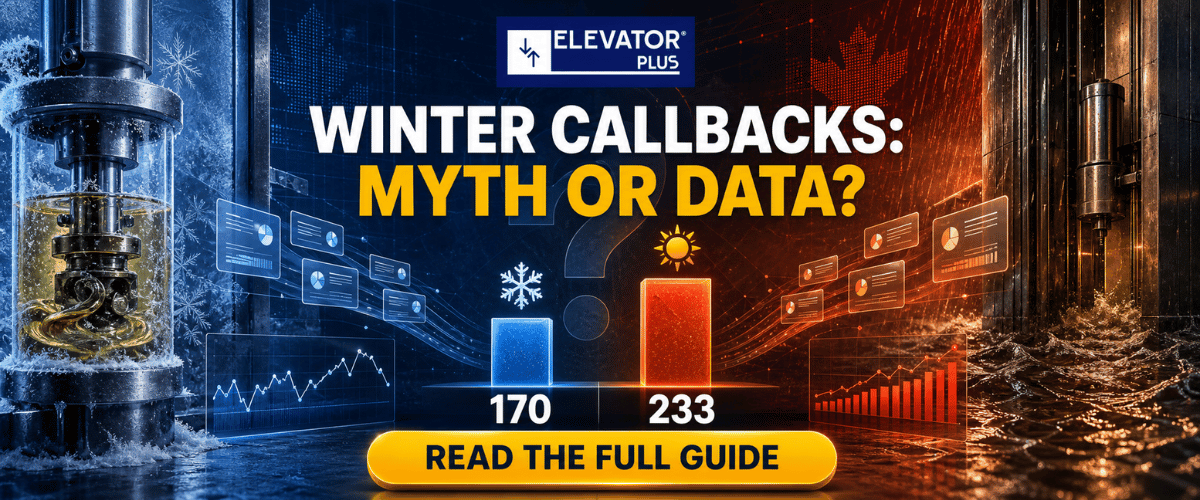
- TSSA's own public outage records point the other way. Our analysis of the public file found 170 reported outages across December to February against 233 across June to August in 2023 and 2024 combined.
- The cold-weather physics is real and citable. Cold hydraulic oil raises viscosity, which makes control valves sluggish and starts jerky. That is documented in peer-reviewed conference literature. It is a mechanism, not a frequency.
- Water damage peaks in summer, not at spring melt. In the same records, the water and flood category is at its highest in July and August.
What this guide covers: what data exists · what TSSA's records show · why the numbers need caveats · the physics that is genuinely supported · what to plan against instead · FAQs.
What actually exists
Canada does collect elevator downtime data. Since 1 July 2022, owners and licensees of elevators in residential buildings and long-term care homes in Ontario have been required to report outages lasting more than 48 hours, within 30 days of the elevator returning to service. TSSA publishes those records publicly, with a CSV export.
That is a genuinely useful dataset and it is more than most jurisdictions have. What TSSA does not publish is any breakdown by month or season.
The absence is consistent across everything else too. TSSA's Public Safety Report 2025 contains no occurrence of winter, weather, cold or temperature. TSSA's Elevator Availability Study of December 2017, the most substantial piece of Canadian research on this subject, does not mention season, winter, weather, cold, temperature or snow anywhere in its 229,000 characters. It simply does not consider seasonality as a variable.
Technical Safety BC publishes annual State of Safety reports with no seasonal cut and no cold-weather cause category. Its 2022 report records 51 incidents province-wide, which is far too small a number to draw a seasonal inference from even if it were broken out.
So when a vendor blog tells you callbacks rise in winter in Canada, the honest question is: according to what?
What TSSA's records show when you cut them by month
We pulled the public file and grouped it ourselves. This is our analysis of TSSA's public outage records, not a published TSSA finding, and that distinction matters.
Across 2023 and 2024 combined, the file contains 170 reported outages in December, January and February, against 233 in June, July and August. Winter is the quietest season in the data, not the busiest.
The water damage and flood category behaves the same way, peaking in July and August rather than during spring melt.
| Period | Reported outages, 2023 + 2024 |
|---|---|
| December to February | 170 |
| March to May | Between the two |
| June to August | 233 |
📲 Join our WhatsApp channel for compliance tips, updates: ElevatorPlus - Business Automation Tool
The caveats, stated properly
We would not build a business decision on that finding alone, and neither should you. Three reasons.
The data is self-reported and unverified. TSSA's own disclaimer says outage information "is provided by building owners, and it is not independently verified by TSSA for completeness or accuracy."
Reporting volume is very uneven year to year across the file, which suggests the numbers partly track compliance with the reporting rule rather than actual outages.
It only captures outages over 48 hours in residential buildings and long-term care homes in one province. A callback resolved in four hours never appears. If winter produces more short callbacks and summer produces more long outages, the file would show exactly this pattern while the lived experience of a service manager pointed the other way.
What we can say is narrower and still useful: the only Canadian dataset that can be cut by month does not support the claim that winter is the bad season, and nobody has published anything that does.
One independent point in the same direction. An analysis of 22,504 New York City 311 elevator complaints found July peaking 62% above the winter low. That is complaints rather than callbacks, and it is not an authoritative source, but two separate North American datasets pointing the same way is worth knowing before you plan a winter surge.
👉 Want to answer this for your own portfolio? Our free breakdown report and service checklist templates are structured so callback data stays analysable later.
The part of the winter story that is real
None of this means cold does not affect elevators. The mechanism is well documented. What is missing is the frequency claim, not the physics.
On hydraulic units specifically, work presented at the International Congress on Vertical Transportation Technologies is direct about it:
"Very low oil temperatures cause sluggish behaviour of control valves and may also lead to cavitation problem…"
"When oil viscosity is very high, i.e., oil is cold, system operation becomes sluggish and unsatisfactory. For example, start of the elevator may be jerky, acceleration and deceleration times become longer."
That paper also makes a point worth carrying into any Canadian maintenance conversation: the correct oil viscosity grade depends on average ambient temperature and usage, and "recommended viscosity grade could be improper as the ambient temperature varies." A viscosity grade chosen for a Toronto summer is not necessarily the right grade in February.
Flooding is the other genuinely supported concern, though again without frequency data. TSSA's Director of the Elevating and Amusement Devices Safety Program put it plainly in April 2026: "In buildings impacted by flooding, the elevators can potentially be compromised. Water can accumulate in elevator shafts or adversely affect an elevator's operation, creating a dangerous situation for passengers including entrapment or injury."
One claim to drop from your own material if it is there. The widely repeated machine-room temperature range of 55 to 90 degrees Fahrenheit is not an ASME A17.1/CSA B44 requirement. The code defers to the manufacturer's specified range. We have seen that number attributed to the code in several places and it does not belong to it.
What to plan against instead
If the seasonal question cannot be answered from published data, the useful move is to answer it from your own.
Most contractors already hold everything needed. Callback date, unit, building, reported fault, resolution. Twelve months of that, grouped by month and by fault category, tells you whether your portfolio has a winter problem, a summer problem, or a specific-building problem that looks seasonal because that building floods.
We expect most operators will find the answer is building-specific rather than seasonal. A hydraulic unit in an unheated garage behaves differently in February. A traction unit in a conditioned core does not. Planning a blanket winter surge for a portfolio where six units drive the pattern is how service capacity gets wasted.
The reason nobody can tell you how much worse winter is, is that Canada does not measure it. You can, for your own units, in an afternoon.
Frequently asked questions
Do elevator callbacks increase in winter in Canada?
There is no published Canadian data showing that. No regulator publishes seasonal figures, and TSSA's own public outage records show fewer reported outages in December through February than in June through August.
Does TSSA publish seasonal elevator outage data?
No. TSSA publishes individual outage records with a CSV export, but no month or season breakdown, and its Public Safety Report and 2017 Availability Study do not address seasonality at all.
Is cold weather bad for hydraulic elevators?
Yes, as a mechanism. Cold oil has higher viscosity, which makes control valves sluggish, can cause cavitation, and makes starts jerky with longer acceleration and deceleration. That is documented in conference literature. What is not documented is how often it causes callbacks.
What is the correct machine room temperature range?
The frequently quoted 55 to 90 degrees Fahrenheit range is not an ASME A17.1/CSA B44 requirement. The code defers to the manufacturer's specified range for the equipment installed.
Which elevator outages have to be reported in Ontario?
Since 1 July 2022, owners and licensees of elevators in residential buildings and long-term care homes must report outages lasting more than 48 hours, within 30 days of the elevator returning to service.
Is the TSSA outage data reliable?
It is self-reported. TSSA states that outage information is provided by building owners and is not independently verified for completeness or accuracy. Reporting volume also varies considerably year to year.
Does water damage to elevators peak during spring melt?
Not in the TSSA records. In our analysis of the public file, the water damage and flood category peaks in July and August.
How should a contractor plan seasonal capacity?
From their own callback data rather than industry assumption. Twelve months of callbacks grouped by month, fault category and building will usually show whether the pattern is seasonal or driven by a small number of specific units.
The winter claim is repeated constantly in this industry and sourced nowhere. That should bother anyone making capacity decisions on it.
The physics of cold oil is real. The frequency claim is not evidenced in Canada, and the one dataset that can be cut by month points the other way. Somewhere between those two facts sits the truth for your specific portfolio, and the only way to find it is your own callback history, grouped and read.
That requires callback data that was recorded consistently enough to group twelve months later. Most operators discover the gap at exactly the moment they want the answer.
👉 See callback patterns across your own portfolio, by month and by building. Book a demo →
Related reading
- Elevator service software built for Canadian contractors
- The Maintenance Control Program: What A17.1 §8.6 Actually Requires On Site
- Reduce Elevator Breakdown Response Time: A Practical Guide
- Elevator Complaint Tracking: A Guide for Service Companies
About the author. Sujit Katariya is part of the ElevatorPlus team, which builds the Elevator Business Operating System used by 200+ elevator companies across 20+ countries. Compliance reviewed by Mr. Sumeet Katariya.
Sources: TSSA, Elevator availability and outage records · TSSA, View elevator outage records · TSSA, Five seasonal flooding safety tips · Celik and Kucur, Importance of Thermal Balance for Hydraulic Elevators, ElevcoN Lucerne 2010 · Technical Safety BC, State of Safety reports
👉 Follow ElevatorPlus on,
Instagram LinkedIn Facebook YouTube Qoura Substack Twitter