
Elevator Technician Utilisation: Measure the Right Thing
By Nutan Mandal, ElevatorPlus · Published 17 August 2026 · Last updated 17 August 2026 · ~7 min read
In short: Jobs per technician per day is a vanity number. It counts attendance, not value, and it quietly pushes despatchers to send whoever is free rather than whoever is right. Measure productive wrench time, first-time fix rate and travel as a share of shift instead. And treat utilisation above roughly 85 percent as a warning, not a trophy.
Key takeaways
- Jobs per technician per day rewards volume, not resolution. Two short visits that fixed nothing beat one visit that solved the fault, on that scoreboard.
- Productive wrench time as a share of the paid day is the honest denominator. Everything else is a proxy for it.
- First-time fix rate is the check on utilisation. Without it you are not saving money, you are moving it into a different column.
- Utilisation above roughly 85 percent means you have no slack for callouts, and the schedule will collapse the first bad morning.
- Geographic clustering and equipment-familiarity clustering pull in opposite directions. Which one wins depends on the fault, not on policy.
- Route density beats pushing people to work faster. A unit 40 km outside your cluster costs you more than three units in the same street, and none of that is the technician's fault.
- Never rank individual technicians publicly on utilisation. You will get tidier job cards and worse information.
What this guide covers: why jobs per day misleads · why the borrowed formula does not fit a contract business · the three metrics that replace it · why 85 percent is a ceiling not a target · geography versus equipment familiarity · route density and contract geography · the loss nobody logs · what utilisation must never be used for · how to start measuring without new hardware
Why is jobs per technician per day the wrong number?
Because it counts arrivals.
A technician who attends six sites and comes back to three of them next week scores six. One who attends four and closes all four scores four. On the board at month end the first looks better. In the accounts the second is why you are still profitable.
Every service manager reading this already knows it. The number survives anyway because it is easy to pull. It falls out of the job sheet without anyone thinking about it, and metrics that are cheap to collect tend to outlive metrics that are useful.
There is a second, quieter harm. When jobs per day is the visible number, despatch optimises for it. The despatcher, doing their best under pressure, sends whoever is free. Not whoever knows that gearless machine. Whoever is free.
In what we see across ElevatorPlus implementations, this shows up in repeat visits within fourteen days. When a company starts tracking that for the first time, it is almost always higher than the service manager expected.
Why does the standard utilisation formula not fit a lift business?
Because it was borrowed from firms that sell time.
Billable hours divided by available hours means something in a consultancy. Every hour is either sold or wasted, so the ratio carries information. A lift maintenance business does not sell hours, it sells a contract. The client pays the same annual sum whether the visit takes 25 minutes or 55. Apply that formula here and the ratio moves for reasons unconnected with how the operation is running. Win more hourly repair work and utilisation climbs. Renew a large AMC portfolio and it falls. You are measuring your revenue mix.
Ask ten lift contractors for their utilisation and you will get ten numbers, all confident, none comparable. One counts hours on site. One counts jobs closed. One counts anything that is not a tea break. So publish the formula alongside the number, or the number cannot be argued with, only asserted.
There is a related trap in the numerator. If the office counts every hour on site as productive, two hours waiting for a building manager to find the machine room key score the same as two hours of service work. Utilisation looks fine. Nothing got done.
What should you measure instead?
Three things, and they only work together.
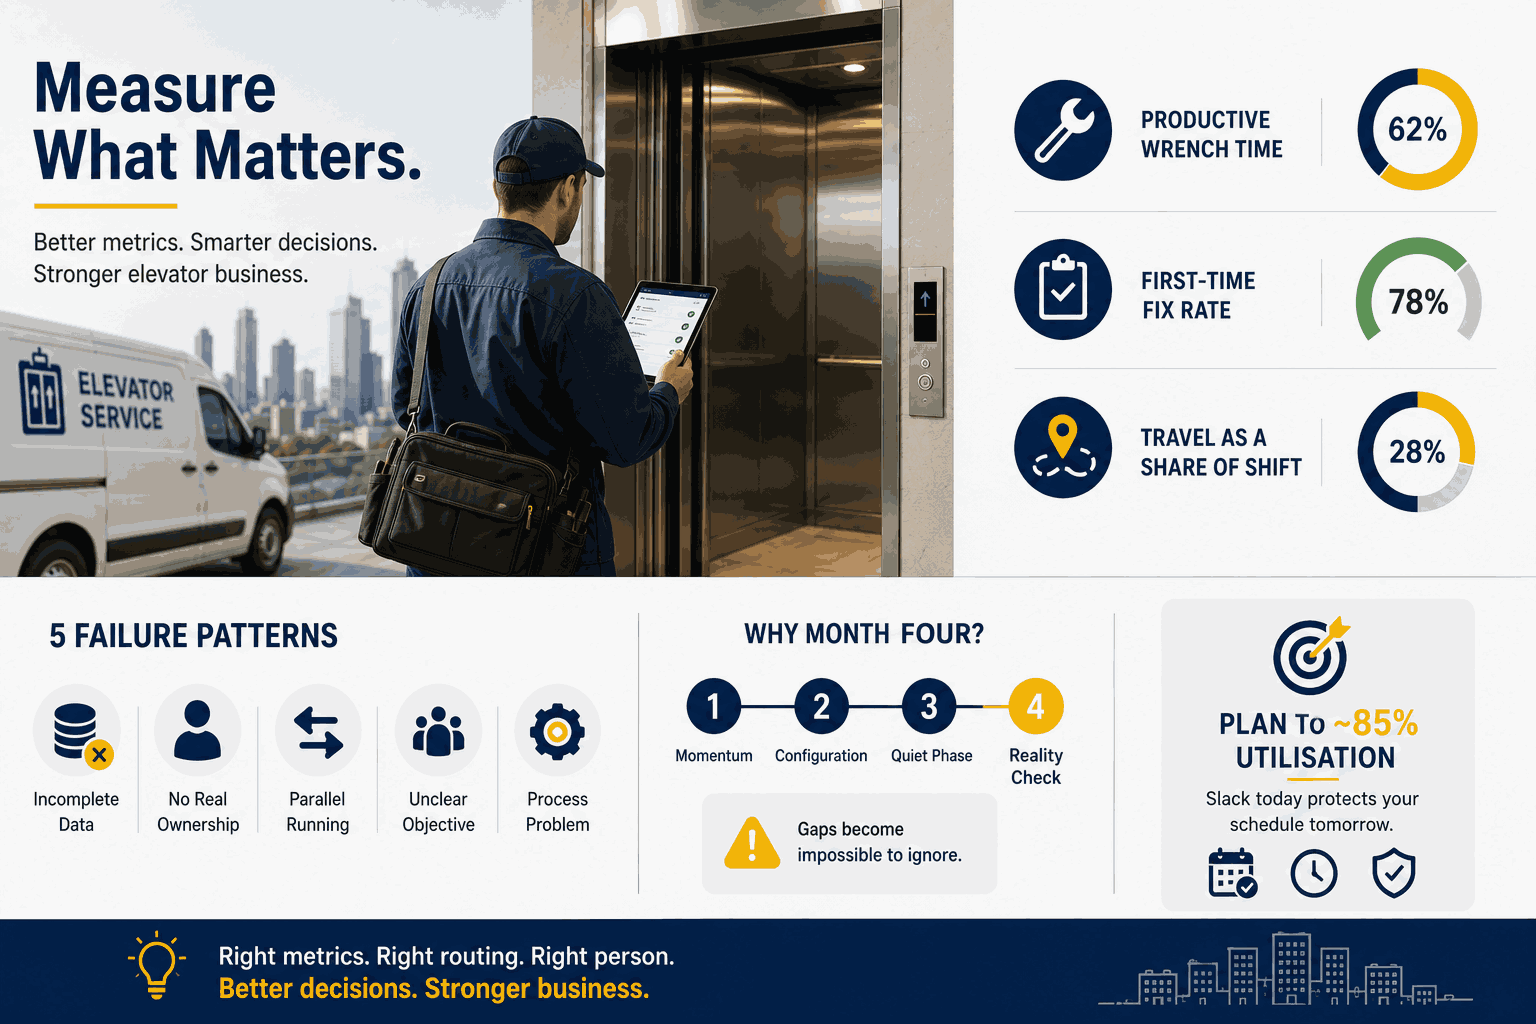
Productive wrench time as a share of the paid day. Hands on equipment, diagnosing or fixing. Not driving, not waiting for a lobby key, not on the phone about a purchase order. If you pay a technician eight hours, what fraction went into a shaft or a machine room? Uncomfortable to measure the first time. Do it anyway.
First-time fix rate. The percentage of callouts closed on the first attendance without a return for the same fault. Define the window before you start or the number will drift.
Travel as a share of shift. Not total travel hours, which tell you nothing without context, but travel divided by paid time. This is the number that exposes bad routing, bad territory design, and the slow creep of accepting work outside your natural footprint because it was hard to say no.
| Metric | What it actually tells you | How it gets gamed |
|---|---|---|
| Jobs per technician per day | Attendance volume | Short visits, deferred diagnosis, splitting one job into two |
| Productive wrench time / paid day | How much of what you pay for becomes work | Loose definition of "productive", counting travel as prep |
| First-time fix rate | Whether the visit resolved anything | Reclassifying a return as a new fault |
| Travel / shift | Territory and routing health | Rarely gamed, which is part of why it is useful |
| Utilisation percentage | How much slack the schedule has left | Counting planned overtime as available capacity |
Notice that the hardest one to game is the least glamorous one. That is usually how it goes.
Why is 85 percent utilisation a warning sign?
Because a maintenance business is not a factory line. It is a queueing system with random arrivals.
Callouts arrive in clumps, on the hot Monday after a wet weekend, on the morning the mains supply dipped across half the district. If your technicians are booked to 95 percent of available hours on planned work, there is nowhere for those callouts to go except overtime, deferred visits, or a customer waiting four hours while the despatcher rings around.
Push utilisation towards 100 percent and waiting time does not rise gently. It rises steeply, then off the chart.
So plan to roughly 85 percent and defend the remaining slack like it is a contract. It is not idle time. It is the capacity that stops one bad morning becoming a bad fortnight of rescheduled PPM and apologetic phone calls.
We get this wrong sometimes too. It is genuinely hard to look at a technician with two free hours on Thursday afternoon and not fill them. Fill them and Thursday is fine. It is the following Tuesday that suffers.
👉 If your schedule has no slack in it, you do not have a schedule, you have a hope.
Should you cluster by geography or by equipment familiarity?
Both, and the answer changes with the job type.
Cluster by geography when the work is predictable. Routine PPM, statutory inspections, planned component swaps where the task is known before the van leaves. Travel is the dominant cost there and familiarity adds little, because the work is procedural. Tight geographic rounds cut travel as a share of shift, and that moves straight into your margin.
Cluster by equipment familiarity when the work is diagnostic. Intermittent faults, controller behaviour nobody can reproduce, an older machine from a manufacturer who no longer supports it. The technician who has seen that fault before will close it in an hour, and the one who has not may not close it at all. Sending the nearest person to a diagnostic job is how you generate the repeat visit that ruins your first-time fix rate.
Most companies pick one policy and apply it to everything. Geographic rounds are easier to plan, so geography wins by default, and then everybody wonders why the difficult sites keep needing three visits.
| Job type | Cluster by | Why |
|---|---|---|
| Routine PPM | Geography | Task is procedural, travel dominates the cost |
| Statutory inspection support | Geography | Fixed scope, fixed duration, easy to route |
| Intermittent or diagnostic faults | Equipment familiarity | Prior exposure is the difference between one visit and three |
| Obsolete or non-supported equipment | Equipment familiarity | Knowledge lives in a person, not a manual |
| Entrapment or safety callout | Whoever is closest, always | Response time overrides everything else |
There is a third axis nobody talks about, which is relationship. Some managing agents will accept a two-hour wait from a technician they know and escalate at forty minutes with a stranger. That is not in any scheduling algorithm. It should be in your despatcher's head.
Why does route density beat pushing people to work faster?
Because you cannot make a van go faster, but you can stop sending it so far.
Every operations manager has tried pushing technicians to work quicker. It rarely holds. Service work takes as long as it takes, and the minutes you shave come out of the inspection, which reappears as a callback three weeks later.
Route density is a planning decision made in the office, and it costs the technician nothing. A unit three buildings from the last one costs you a walk. A unit 40 km outside the cluster costs you the drive out, the drive back, the fuel, and the two units that could have been attended in that window. Same technician, same effort, a fraction of the output, and none of it is their fault.
Which means sales and operations need to talk before a contract is signed. A profitable-looking AMC in a town where you hold one other unit is usually not profitable. It is a subsidy paid by your denser routes.
A worked example, purely illustrative, using invented inputs so that you substitute your own. A technician works a 480 minute day, attends five units and spends 190 minutes on the road. Travel is roughly 40 percent of the day. Recluster so travel falls to 130 minutes without changing any visit length and you release 60 minutes, which at an average 55 minute visit is close to one more unit per technician per day. The point is not the answer. It is that the lever was the route, not the person.
The loss nobody puts on a report
The phone call.
A technician arrives at a site with six lifts and does not know which one they are attending. Or knows the unit, but not what was done last visit, whether the door operator was already flagged, or whether the part is in the van. So they ring the office. Somebody looks for the file. Somebody rings back.
Ten minutes, maybe fifteen. Multiply by your technicians and your visits and a meaningful part of the week is gone, invisibly, because nobody logs it. It never appears as downtime. It appears as a slightly slower day, every day.
That is the loss an Elevator Business Operating System is meant to remove: unit history, last service notes, open observations and parts position on the technician's phone before they walk into the building. Not faster technicians. Better informed ones.
What should utilisation never be used for?
Ranking individual technicians on a wall chart.
It looks like accountability. It behaves like an incentive to write better job cards. Publish a league table and within two months technicians are closing jobs faster, recording fewer observations, declining to flag the marginal door lock that would have taken forty minutes, and quietly avoiding the difficult sites. The numbers improve and the portfolio degrades.
Use utilisation to judge the system: routes, stores, scheduling, information. Never as a public score. The best technician in your firm is often the one with unremarkable numbers and a set of buildings that never call you.
What does chasing utilisation cost you if first-time fix falls?
It costs you the saving, and then a bit more.
Work through it. You tighten the rounds. Travel drops. Each technician attends more sites and utilisation climbs. But because you are now sending whoever is closest rather than whoever knows the equipment, a proportion of those visits do not resolve the fault. Each one becomes a return visit carrying its own travel, its own paid hour, its own van cost, and, on a response-time clause, its own contractual exposure.
You have not saved money. You moved it out of the travel column and into the rework column, where it is harder to see, and spent some customer patience on the way.
Utilisation alone tells you how busy people were. Utilisation alongside first-time fix tells you whether being busy achieved anything.
How do you start measuring this without buying anything new?
Start with a month of honest timestamps.
You do not need telematics or an engineering study. You need arrival time, departure time, and one line from the technician about whether the fault was closed. Four weeks of that gives you a defensible baseline. It will be rough. It will still beat the number you are currently using.
Then define your terms in writing, because every argument you are about to have will be a definitional one. When does a visit count as "resolved"? Is a return for an ordered part a first-time fix failure? Our view is that it is not, provided the diagnosis was correct on the first visit, but you have to pick a position and hold it.
And publish the numbers to the technicians before the board. People argue with a number they first see in a management meeting. They help you fix one they saw first.
📲 Join our WhatsApp channel for compliance tips, updates: ElevatorPlus - Business Automation Tool
Frequently asked questions
1. Is jobs per technician per day ever useful?
As a capacity planning input, yes. As a performance measure, no. Use it to size the team, never to rank people in it.
2. What is a realistic productive wrench time percentage?
It varies enormously with portfolio density, so treat any single figure quoted at you with suspicion. Measure your own, then improve on it.
3. How long should the first-time fix window be?
Fourteen days suits most portfolios. Extend to thirty if parts lead times in your market are long, then leave it alone.
4. Does the 85 percent ceiling apply to planned-only teams?
Less strictly. If a team never takes callouts you can plan them tighter. The moment they are in the callout pool, the ceiling applies again.
5. Won't technicians resist being timed?
Some will, if it arrives as surveillance. Far fewer if it arrives as evidence the round is overloaded, which is usually what the first month of data shows.
6. Should utilisation targets differ by seniority?
Yes. Your most experienced people carry the diagnostic work and therefore the least predictable durations. Holding them to a PPM round's utilisation punishes them for doing the hard jobs.
7. What about dense urban portfolios?
Travel as a share of shift can still be high because of parking, access and lobby waiting. Measure it rather than assuming proximity solves it.
8. Do we need software for this?
Not to start. You will want it once you are tracking monthly across more than a handful of technicians, because manual collection decays fast. What software removes is specific: the call to the office, the second visit for a part, the wrong unit on the job card. Route decisions and contract geography are still yours to make.
9. Does utilisation apply to modernisation and installation crews?
Differently. Project work is measured against a programme and a budget, not a route. Keep those crews out of your maintenance figures entirely.
10. Is there a published industry benchmark we can measure ourselves against?
We could not find one from a primary source, and any figure quoted at you without its formula is meaningless. Set a baseline from your own data and track the direction of travel.
Measure the paid day, not the number of doorbells rung. Productive wrench time tells you what the wage bill bought. First-time fix tells you whether the visit was worth making. Travel as a share of shift tells you whether your territory design is honest. Keep the ceiling at roughly 85 percent, because the slack is what stops every other number falling over on a bad Monday.
Fill the slack and you will look efficient right up until the week you are not.
See how ElevatorPlus tracks technician time, first-time fix and travel in one place →
Related reading
- Elevator operational metrics 2026
- Why elevator software fails in month four
- Technician software adoption in elevator companies
- Lift maintenance checklist 2026
About the author · Nutan Mandal is part of the ElevatorPlus team, which builds the Elevator Business Operating System used by 200+ elevator companies across 20+ countries.
Sources: No external statistics are cited in this article, because we could not find a published utilisation benchmark for lift maintenance from a primary source. The observations on repeat visits and portfolio patterns come from ElevatorPlus client onboarding, 2026. The travel and reclustering example is illustrative and uses invented inputs, clearly labelled as such, so that you substitute your own operational data.
👉 Follow ElevatorPlus on,
Instagram LinkedIn Facebook YouTube Qoura Substack Twitter